|
Time to geek out about emulsion making and characterization data for the emulsion. TL;DR: Science, science, science, then a characteristic curve plot. I've been characterizing my emulsion batches for some time now, primarily to ensure batch-to-batch consistency but also to help troubleshoot issues that may come up from time-to-time. Beginning with batch 20, I started using a more advanced mixing head when making emulsion. I wanted to accomplish two things: 1) minimize the amount of air whipped into the emulsion, which causes foaming and introduces air bubbles which are difficult to remove and increase the risk of defects such as pinholes in the final emulsion. 2) Delicately improve the shadow details to help with scanning and printing to modern multigrade paper. I say delicately because I worked to still retain that late 19th century look for printing with processes from the time period. This results in a longer toe in the characteristic curve which helps scanning and makes the shadows look really nice. You can see this in the data plots for batches 20, 28, 29 in the chart. The trade-off was decreased contrast and (I think) about 1/2 stop loss in speed. However, I don't want to go back to the old method of mixing because the plates are cleaner with less undesirable defects (vs the desirable characteristics of hand-coating the plate). While the contrast is still high compared to film, the highlights don't quite pop like older plates... or at least that's what my impression is. So I did some testing and researching and figured out what needed to be done to increase the contrast in the highlights.. the result is batch 30. I still need to go out and get some photos under real world conditions, but the batch looks promising. I'll save that for the next post. So what you see below is the raw D logH curve for my emulsion for batches 20, 28, 29, and 30. These curves were generated with a uniform tungsten source measured with a calibrated light meter ... not a photographic light meter for metering a scene, but the kind that an optical engineer such as myself would use for scientific testing (read: more precision and readings given in radiometric values). The 4x5 plates are exposed through a calibrated 21-step 4"x5" wedge at a light level and exposure time to cover the linear region of the curve. After development per my recommended method (note the temperature is captured), the plates are allowed to dry and then measured with a calibrated densitometer. Aside from the test batch, gamma is a hair under 0.8. I'm pretty pleased at the consistency of the batches (all things considered, and not counting #30, the test batch), which is something that I've spent a lot of effort to ensure. I think I do need to kick the speed up a bit, just based on taking photos outdoors in the New England winter. I don't think the mixing method changed the speed, but highlighted the speed loss from some other source (if that makes sense). I have a couple of suspects, but I still need to test... in any case, increasing speed isn't difficult. So I'm at a decision point One note: Take the log H axis values with a grain of salt: The specific values were loosely anchored to bright sunlight conditions in early fall New England, and of course this a non-panchromatic, non-orthochromatic emulsion varies significantly with the ambient UV levels, so you can only get in the ballpark (~ASA 2) for practical metering purposes anyhow. What it does show is that this emulsion is much slower than modern films (duh), and is what you would expect if you were to make your own without sensitization. In an upcoming blog, I'll compare to what I get when I add a sensitizer such as sulfur or gold .. an important step for getting to "handheld speeds". :) 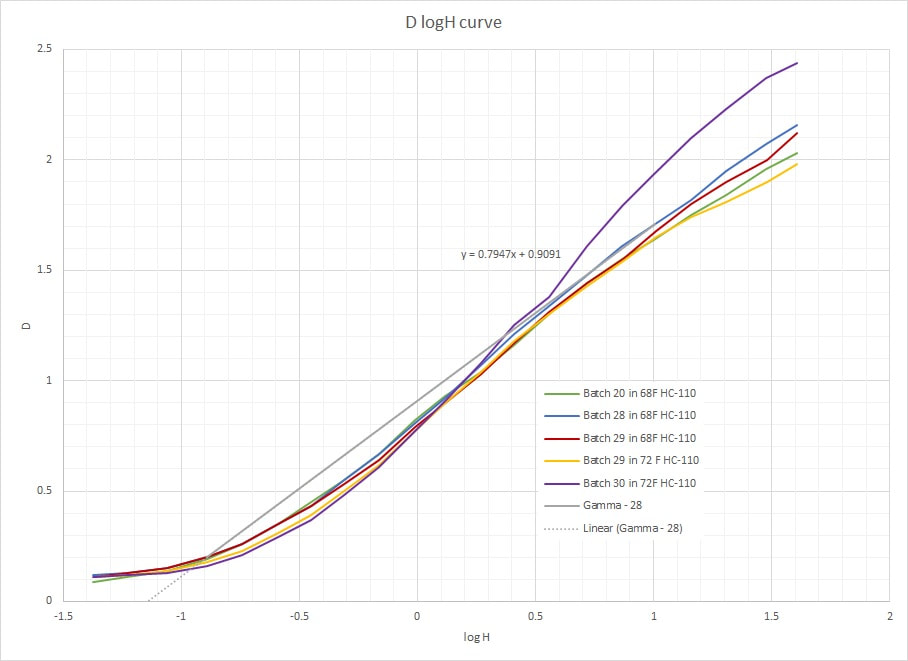 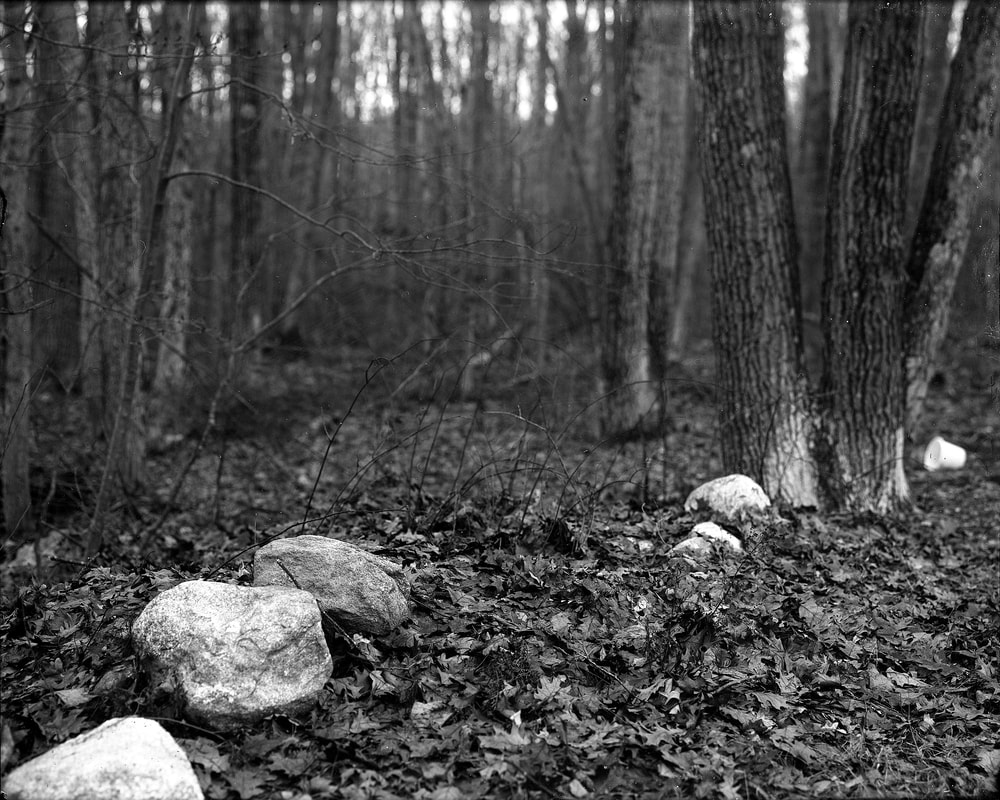 Rocks and Tree, scan of a batch 30 dry plate |
AuthorI'm the guy behind the curtain, Jason Lane, coating plates instead of sleeping. Archives
June 2022
Categories |
 RSS Feed